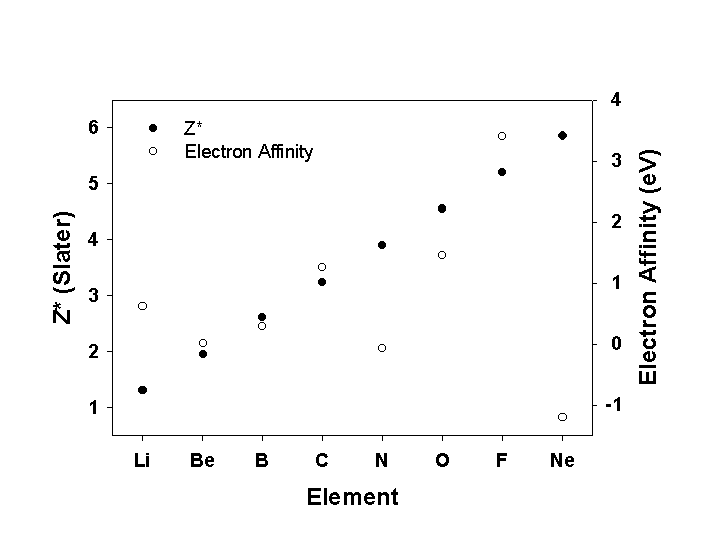
4 On the attached graph paper, plot electron affinity and Z*
(calculated using Slater's rules) as a function of atomic number for the
atoms from Li to Ne. In general, does Z* account for the variation in electron
affinity? Why or why not? Are there any specific anomalies in the trend?
If so, give an explanation.
| Element |
|
|
|
| Li |
|
|
|
| Be |
|
|
|
| B |
|
|
|
| C |
|
|
|
| N |
|
|
|
| O |
|
|
|
| F |
|
|
|
| Ne |
|
|
|

Generally, Z* and EA give the same trend. However, N and Ne are very low: N is half-filled and Ne is filled, neither want to remove this stability and add an electron. Li is a bit high perhaps, maybe because the product anion is a filled shell.